TLS · MEP · Industrial Infrastructure
Industrial3D
A Terrestrial LiDAR Point Cloud Dataset and Cross-Paradigm Benchmark for Industrial Infrastructure

A Terrestrial LiDAR Point Cloud Dataset and Cross-Paradigm Benchmark for Industrial Infrastructure
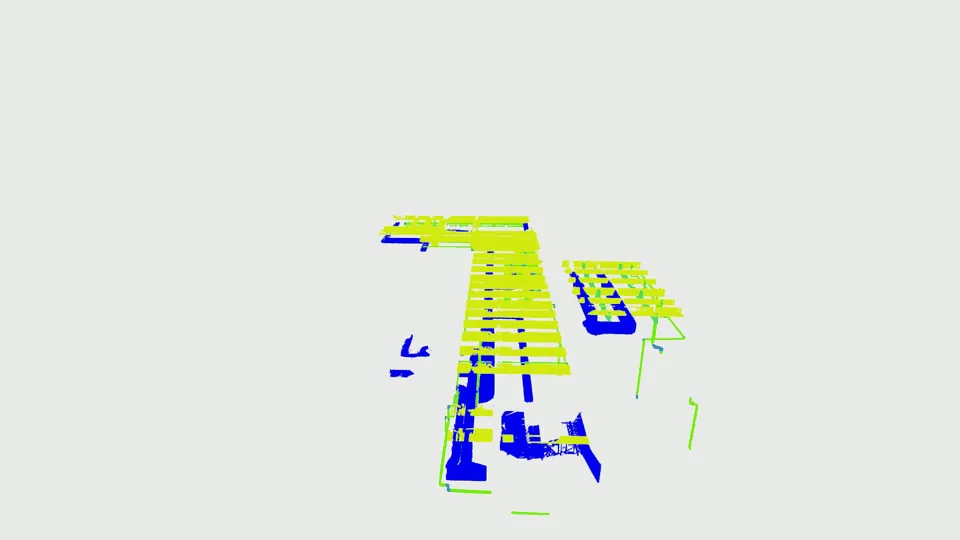
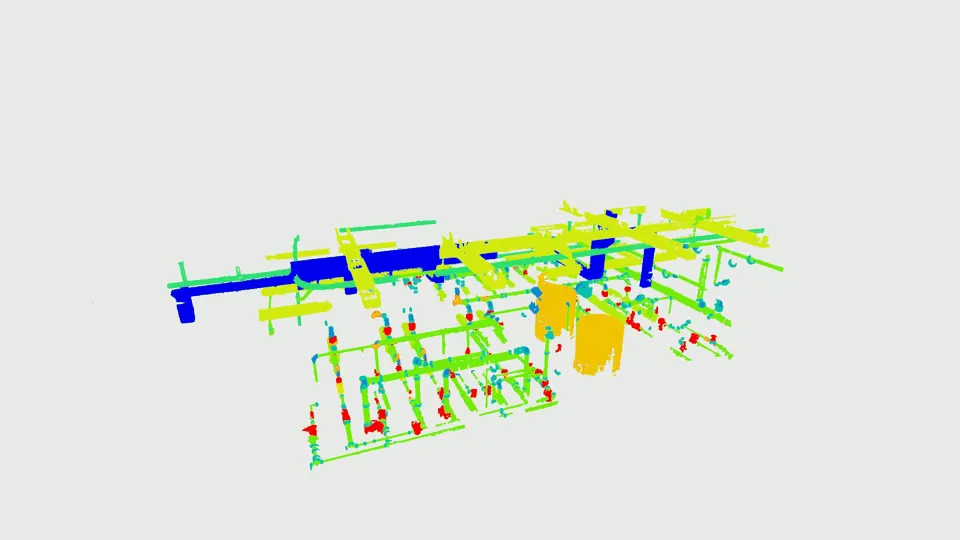
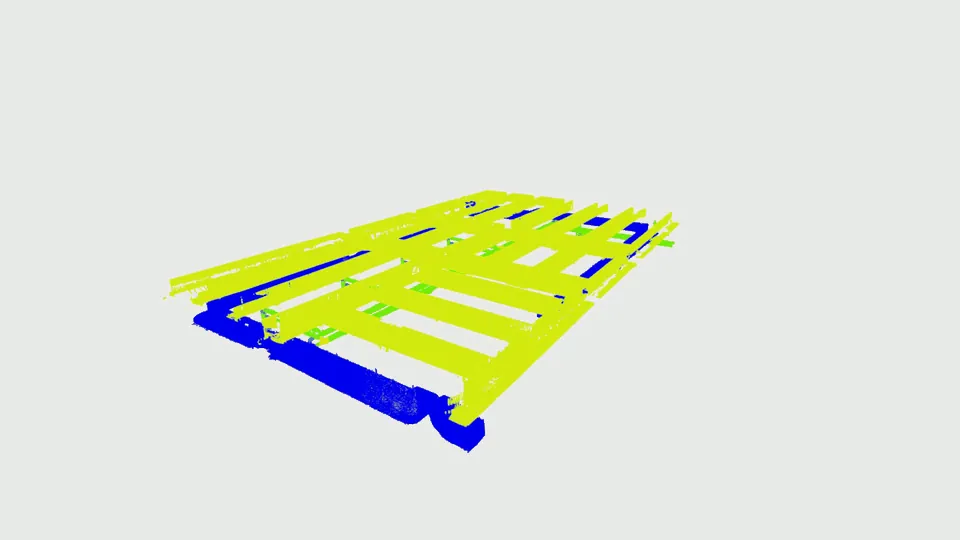
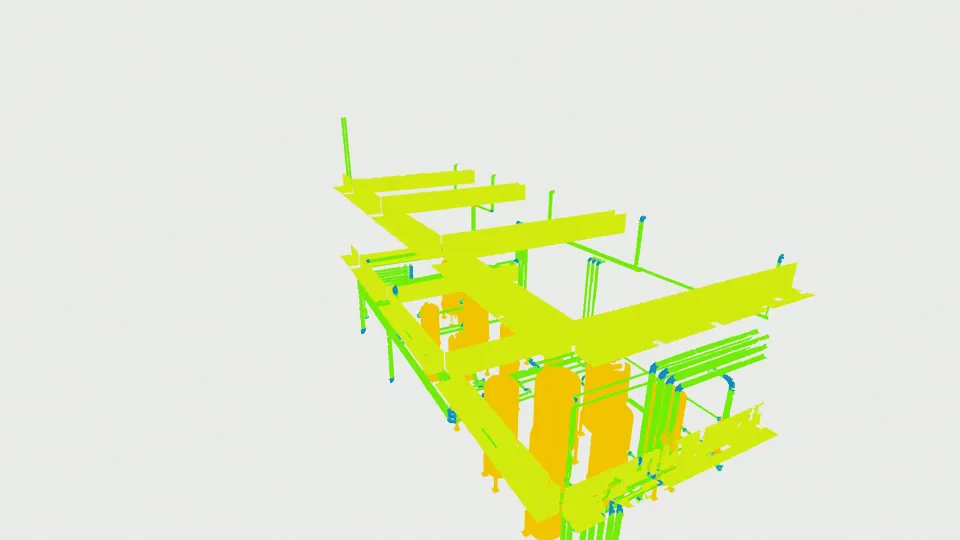
Ground-truth annotated point clouds from four representative rooms. Each color encodes one of the 12 MEP classes. Click any scene to view it full-screen.
 ⤢ Enlarge
 ⤢ Enlarge
 ⤢ Enlarge
 ⤢ Enlarge
Automated semantic understanding of dense terrestrial laser scanning (TLS) point clouds is a prerequisite for Scan-to-BIM, digital twin maintenance, and as-built verification. Yet for operational industrial mechanical, electrical, and plumbing (MEP) facilities, this challenge remains largely unsolved: water-treatment TLS scans exhibit extreme geometric ambiguity, severe occlusion, and extreme class imbalance that architectural benchmarks such as S3DIS and ScanNet cannot adequately represent. We present Industrial3D, a terrestrial LiDAR dataset with 612.7 million expert-labeled points at 6 mm resolution from 20 room scenes, 13 dataset areas, and 7 operational water treatment facilities. At 6.6× the scale of the closest comparable MEP dataset, Industrial3D provides the largest industrial MEP testbed for within-domain scene understanding. We further establish a cross-paradigm benchmark of nine methods across fully supervised, weakly supervised, unsupervised, and foundation-model settings. The best supervised method reaches 55.74% mIoU, whereas zero-shot Point-SAM reaches 15.79%, a 39.95 percentage-point gap that quantifies unresolved domain transfer for industrial TLS data. Analysis attributes this gap to a dual crisis: 215:1 statistical rarity and cylindrical geometric ambiguity between tail classes and head-class pipes.
Four contributions that advance the state of industrial 3D scene understanding.
612.7M expert-labeled points at 6 mm TLS resolution across 12 specialized classes, 20 room scenes, and 13 areas from 7 operational water treatment facilities. 6.6× larger than the closest comparable MEP dataset.
9 representative methods evaluated across fully supervised, weakly supervised, unsupervised, and foundation model settings under a unified PyTorch codebase with reproducible configurations.
Quantifies three persistent industrial challenges: extreme class imbalance, sparse supervision effects, and foundation model domain adaptation gap — connecting results to underlying causes.
39.95 pp gap between best supervised (55.74% mIoU) and zero-shot foundation model (15.79%). 0.1% labels with SQN matches or exceeds full supervision within the same backbone family.
Industrial TLS data exposes two compounding failure modes that architectural benchmarks cannot represent.
9 methods evaluated across 4 learning paradigms on Industrial3D test set (Areas 6 + 12, 84.9M points).
| Paradigm | Best Method | Labels | mIoU |
|---|---|---|---|
| Fully-Supervised | Boundary-CB | 100% | 55.74% |
| Weakly-Supervised | SQN | 0.1% | 44.29% |
| Unsupervised | GrowSP | 0% | 11.73% |
| Foundation Model | Point-SAM (Oracle) | 0% (zero-shot) | 21.08% |
Real operational industrial environments with authentic occlusion, noise, and mechanical complexity.

Facility-scale overview showing UAV photography and color-coded annotated point clouds from operational water treatment facilities in Hong Kong.
✉ Corresponding author: Difeng Hu <difenghu@cityu.edu.hk>