Industrial3D Dataset

612.7 million expert-labeled points from 20 room scenes, 13 areas, and 7 operational water treatment facilities — the largest publicly available industrial MEP dataset.

12-Class MEP Taxonomy

Classes organized by frequency tier. Tier 1 dominates 77% of labeled points; Tier 3 spans 7 classes totaling only 3%.

Tier 1 — Head ≈ 77% of all points
Pipe / Pip
Cylindrical conduits for fluid transport across all diameters.
Rectangular Beam / RBeam
Rectangular structural steel support members and cable trays.
Duct / Dct
Rectangular air-handling conduits for HVAC and ventilation.
Tier 2 — Common ≈ 20% of all points
I-Beam / IBeam
I-shaped structural steel beams for primary structural support.
Tank / Tnk
Large cylindrical or rectangular water/chemical storage vessels.
Tier 3 — Tail ≈ 3% of all points · 7 classes · 215:1 imbalance vs. RBeam
Flange / Flg
Circular disc connectors joining pipe sections at bolted joints.
Valve / Val
Flow-control devices (gate, ball, butterfly) on pipelines.
Pump / Pmp
Mechanical devices for moving fluid through the system.
Strainer / Str
In-line filtration devices preventing debris from entering equipment.
Elbow / Elb
45° and 90° curved pipe connectors for directional changes.
Tee / Tee
T-shaped junctions splitting or combining pipe flows.
Reducer / Rdr
Concentric or eccentric fittings for pipe diameter transitions.
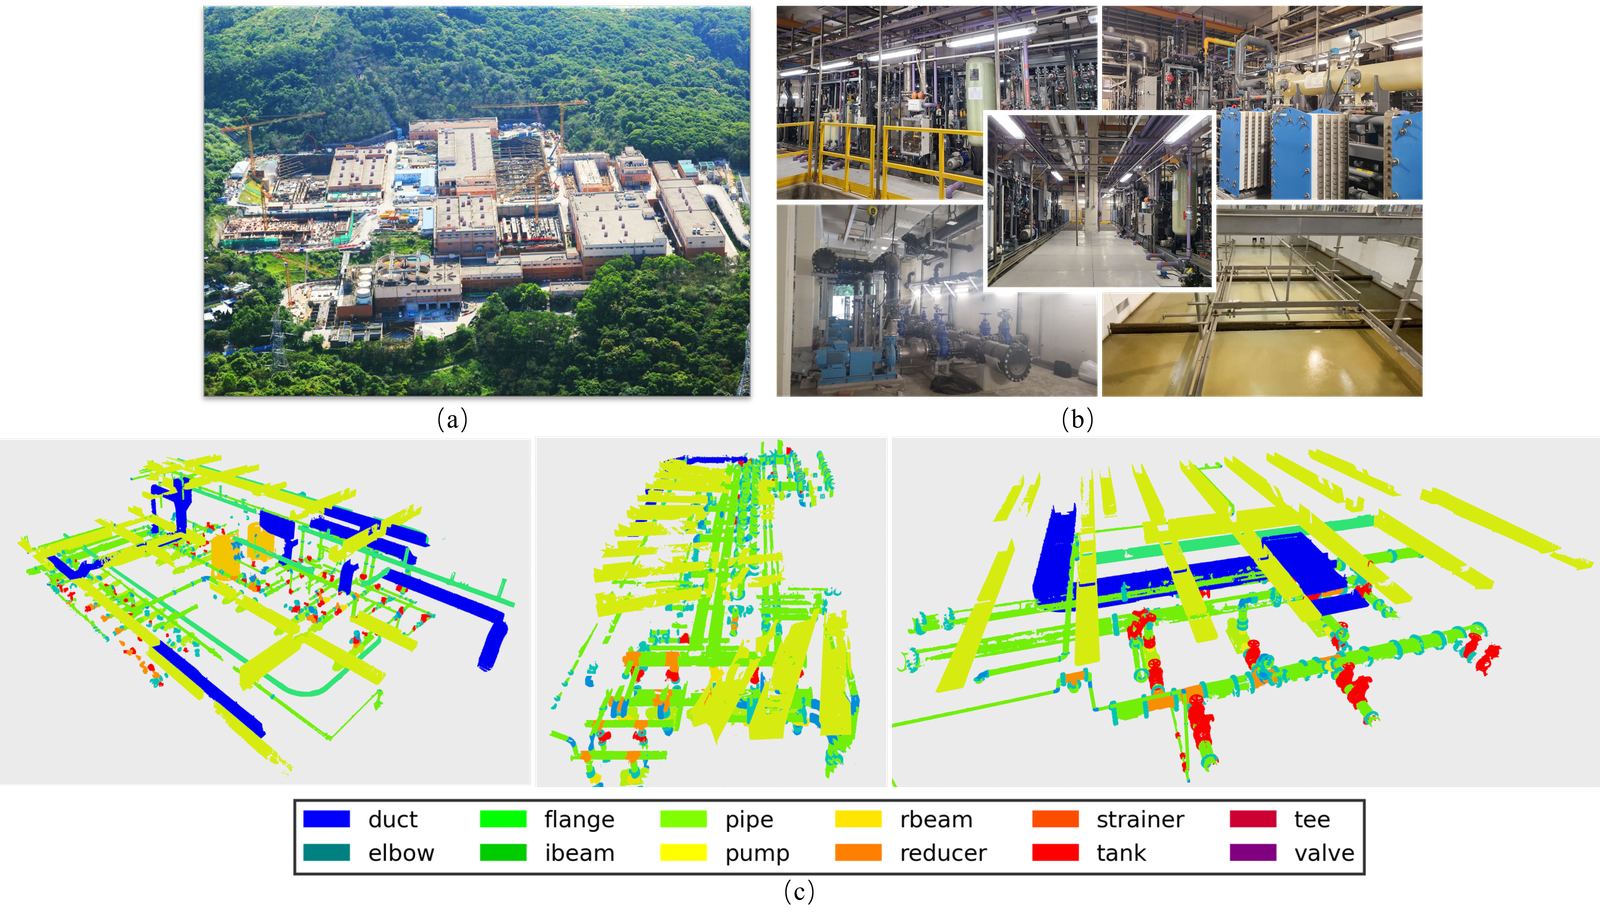
All 12 semantic classes illustrated with point cloud examples ⤢ Click to enlarge

All 12 semantic classes illustrated with representative point cloud examples at 6 mm TLS resolution.

Distribution & Scale

Long-tail class distribution with a 215:1 head-to-tail ratio — 3.5× more severe than S3DIS.

Class distribution across 3 tiers showing 215:1 imbalance ⤢ Click to enlarge

Long-tail distribution of 612.7M labeled points across 3 tiers. The 215:1 head:tail ratio drives the dual crisis.

Dataset At a Glance
Total labeled points 612.7 M
Raw scan points 2.3+ B
TLS resolution 6 mm @ 10 m
Ranging accuracy 4 mm @ 10 m
Point attributes XYZ + RGB + I
Annotation effort 754 person-hours
Class imbalance ratio 215 : 1
Scale vs. closest MEP 6.6× larger
Acquisition

Captured using a Leica BLK360 terrestrial laser scanner in operational water treatment facilities in Hong Kong. Each room was scanned from multiple stations (2–8 per room) to minimise occlusion. Raw scans were registered using Leica Cyclone, then merged and manually annotated in CloudCompare.

Representative Scenes

20 unique rooms across 13 areas. 4 representative scenes shown with ground-truth annotations. Click any image or video to view it full-screen.

Scene gallery: 4 representative Industrial3D scenes ⤢ Click to enlarge

Scene gallery: 4 representative rooms showing annotated point clouds from training and test areas.

TRAIN ⤢ Enlarge
Area 2 — Service Gallery
Largest scene at 79.6M points. Highest MEP density with dense pipe networks, cable trays, and structural steelwork.
TEST ⤢ Enlarge
Area 12 — SPH Pump Room
Primary test scene. Compact equipment room with pump arrays, valves, and dense pipe connections — representative of test-set difficulty.
TEST ⤢ Enlarge
Area 6-1 — 93m Psu Room
Moderate complexity with large pump sets and parallel pipe runs. Test set area with both head and tail class instances.
TRAIN ⤢ Enlarge
Area 3 — 93m Tank Area
Large-scale tank structure showing geometric diversity between tanks, pipe bundles, and structural steelwork at facility scale.
Additional Industrial3D scenes ⤢ Click to enlarge

Additional scenes from the dataset showing the diversity of industrial environments across the 13 areas.

Train / Validation / Test Protocol

Area-based splits following S3DIS convention to prevent data leakage between rooms of the same facility.

Split Areas Points % Total Description
Train 1, 2, 3, 4, 5, 7, 8, 10, 11, 13 (10 areas) 527.8 M 86.1% Primary training set. Includes the largest area (Area 2, 79.6M pts).
Val 9 (OSCG) (1 area) 15.1 M 2.5% Validation area used for hyperparameter tuning.
Test 6 (93m Psu/VSPA-1) + 12 (SPH) (2 areas) 84.9 M 13.9% Held-out test set. Evaluated via vote-based smooth testing (test_smooth = 0.95).

Evaluation Metric

Mean Intersection over Union (mIoU) across all 12 classes. Vote-based evaluation with test_smooth = 0.95 is the standard protocol. Per-class IoU is reported for all 12 classes to expose failure modes on tail classes (Reducer, Strainer, Pump, etc.).

Access the Dataset

Under Review. Full dataset (points, labels, splits) and benchmark code will be released upon journal paper acceptance. Preview materials (videos, figures) are available now via GitHub and Google Drive.
📄
Paper (arXiv)
Read the full paper including dataset construction protocol, annotation methodology, benchmark results, and analysis.
arXiv:2603.28660 →
GitHub Repository
Benchmark code, PyTorch implementations, training configs, and evaluation scripts. Pre-trained models released upon acceptance.
github.com/PointCloudYC/Industrial3D →
🗂
Preview Materials
RGB + ground-truth videos and renders for 4 representative rooms. Available on Google Drive now.
Google Drive →
📦
Full Dataset
20 room scenes, 612.7M labeled points in .txt + .ply format (XYZRGB + class labels). Released upon journal acceptance.
Coming Soon

Data Formats

The dataset will be provided in two formats:

  • .txt — space-delimited: X Y Z R G B label per point
  • .ply — binary PLY with vertex attributes: x y z red green blue label

Labels are integer class IDs (0–11) matching the order: Duct, Elbow, Flange, IBeam, Pipe, Pump, RBeam, Reducer, Strainer, Tank, Tee, Valve.